Over the past several years there’s been a lot of derogatory talk against traditional market cap weighted indexes.
And one of the oft-repeated arguments against traditional indexing that you’re guaranteed to read about or see is something like, “Market cap weighted indexes overweight overvalued large-cap stocks and underweight undervalued smaller-cap stocks.” As a result of these arguments, there’s been a relentless crusade to demonize the “imperfections” of traditional indexes, which like it or not, still represent hard to beat market performance.
LISTEN: Portfolio Exam on a $477,000 Investment Account
Funds and ETFs linked to equal-weight indexes are one example of an alternative indexing strategy that is often sold as a superior choice to traditional market cap weighted funds. Is it true?
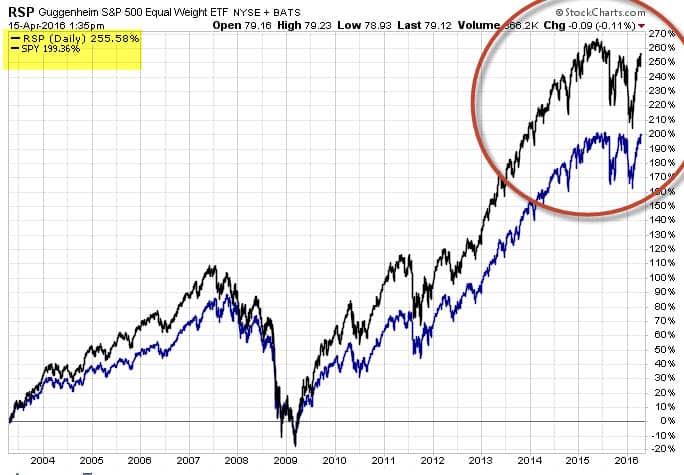
Below, I plotted the performance of the Guggenheim S&P 500 Equal Weight ETF (NYSEARCA:RSP) versus its market cap weighted cousin, the SPDR S&P 500 ETF (NYSEARCA:SPY). As you can see, since 2003, RSP has gained +255% compared to just a +199% gain for SPY. On the surface, it appears that RSP is the superior S&P 500 ETF. But is it really so?
RSP takes each stock within the S&P 500 and assigns it an equal weighting of 0.20% within the index. (0.20% weight x 500 stocks = 100% allocation) This approach neutralizes the influences of larger stocks. That means smaller companies like CarMax, Exelon, and Freeport-McMoran have the same 0.20% weighting as mega-cap stocks like Apple, Microsoft, and Johnson & Johnson. In a traditional S&P 500 market cap weighted setting this sort of effect would never occur because only the largest stocks dominate the performance and behavior of the index.
TEXT 33444 and TYPE “PORTCHECK” to receive your free portfolio checklist
The Direxion NASDAQ 100 Equal Weight ETF (NYSEARCA:QQQE) uses a similar approach to RSP, but applied to the NASDAQ-100 index (NasdaqGM:QQQ).
Since it’s inception in 2012, the equal market cap weighted QQQE has underperformed the traditional market cap weighted QQQ by 7.7%. This doesn’t necessarily prove that QQQE is inferior, but rather shows that equal weighted indexes do in fact have biases. And these biases tend to mimic traditional cap weighted mid-cap (NYSEARCA:VO) and small-cap indexes (NYSEARCA:IJR).
Our next chart illustrates my point. It plots RSP versus the SPDR MidCap S&P 500 ETF (NYSEARCA:MDY). Although each respective ETF holds completely different stocks, both funds are highly correlated. It’s mainly because the effect of equal weighting the S&P 500 gives it a similar return profile to a market cap weighted mid-cap ETF.
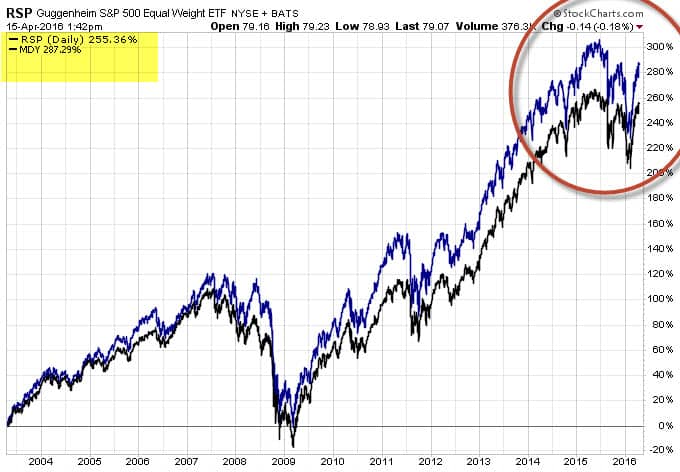
As the chart above illustrates, MDY outperformed RSP by +31.93% since 2003. And it achieved this feat with lower annual costs.
Other mid-cap ETFs like the Schwab U.S. Mid-Cap ETF (NYSEARCA:SCHM) charge less than both MDY and RSP for similar exposure. The cost of SCHM is five times less or just 0.07% annually compared to RSP’s 0.40% annual fees. In other words, paying 0.40% for an S&P 500 equal-weight fund is an expensive proposition compared to less expensive market cap weighted mid-cap ETFs that offer a similar return path.
WATCH: How many ETFs do you need to build a well-rounded portfolio?
In summary, equal-weighted indexes are not bias-free because they introduce their own set of biases. If smaller stocks, for instance, are in favor and outperforming, the biases of equal-weighting will look smart. But if smaller stocks are out-of-favor and underperforming relative to the rest of the stock market, the results of equal-weighting will likely be inferior to traditional market cap weighted indexes.
Finally, the same rules apply to so-called “smart-beta” ETFs, which like equal weighted benchmarks, have their own unique biases. In other words, any out or under-performance of these new breed ETFs against traditional market cap weighted index benchmarks is 100% attributable – not to revolutionary paradigms or genius index manufacturers – but rather, to the popularity (or lack of it) to the distinct biases of the underlying index.